
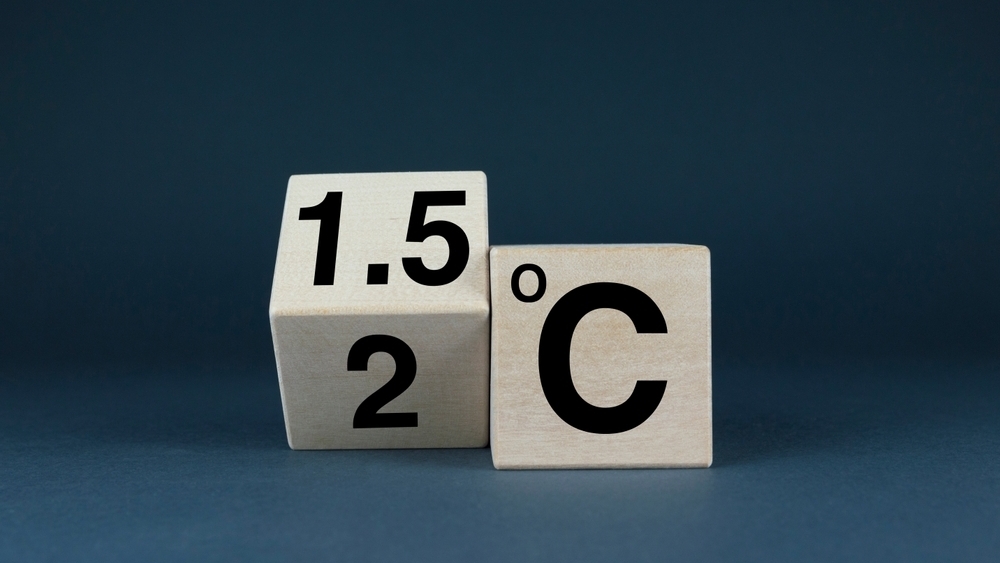
Brace for impact: climate scenario models grapple with 1.5°C overshoot
The UNEP’s confirmation makes a disorderly transition more likely, experts warn
“Exceedance of 1.5°C is coming in the next few years”, warns a recent report from the United Nations Environment Program (UNEP). To the 195 parties of the Paris Agreement, the setback to their warming goal had been a long time coming. In recent years, warnings of the goal becoming elusive were not uncommon to hear.
NZI Transition and Climate Investment Conference | 22 October | London | Register here
Courtesy of policies and markets becoming increasingly misaligned with the Paris ethos.
UNEP’s confirmation of a widely acknowledged unfortunate reality has implications for investors and their climate investment plans. Not only does it shift the probabilities of scenarios they work with, but it also makes a disorderly transition seem more likely than ever before.
Long time coming
To the providers of scenarios, the 1.5°C did not come as a surprise. Last year, Ortec Finance – one such provider – moved the expected temperature outcome of their net zero scenario from 1.5°C to 1.6°C.
“We find that even with a huge, immediate and global step-up in ambition, it is still not technically feasible to reach 1.5°C. Our NZ scenario (reaching 1.6°C) is what we consider to be at the limit of what is technically feasible, but this is not politically realistic, since we see no indication of a sudden and immediate increase in ambition”, says Maurits van Joolingen, managing director for climate scenarios and sustainability at Ortec Finance.
Joolingen’s feasibility assessment is not too far from the one Trex, another scenario analytics company, arrived at. “At Trex we focus on plausible scenarios, and the science had already shown that staying under 1.5C was quite implausible”, commented Willemijn Verdegaal, the company’s co-founder and chief product officer.
The UNEP report points out the causes. Citing academic evidence, the authors point out a rate of warming estimated at roughly 0.25°C per decade. Add to that five-year mean forecasts from the World Meteorological Organisation (WMO) and the 1.5°C overshoot becomes visible over the immediate horizon. ‘Next few years’, to borrow the UNEP’s phrasing.
Where to next
Verdegaal, who was previously a MSCI executive and director for climate strategy at Ortec Finance, says the UNEP report does more than merely confirm the overshoot.
It crucially shifts probabilities associated with the remaining scenarios. “Essentially, it makes higher warming scenarios more likely. It does not change the assumptions of those higher warming scenarios as such”, she explains.
Joolingen warns of another key implication – locked in physical risk. “One thing we know is that, whatever pathway we end up on, extreme weather events will intensify, in terms of frequency and magnitude, and we will see larger productivity losses from a world with higher temperatures”, he told Net Zero Investor.
For Ortec’s clients, Joolingen reckons a delayed net zero scenario is now in the spotlight. One of its key features is higher minimum impact estimates of physical risks on asset prices and capital market assumptions.
“For us, the key implication of the 1.5°C overshoot is that our clients should focus on the next best thing. In our scenario overview that means aiming for a Delayed Net Zero scenario”, he says.
Disorderly transition
Looking ahead, both Joolingen and Verdegaal reckon a disorderly transition is something investors should view as more likely.
The transition outlook, in lieu of the 1.5°C overshoot is delayed, disruptive and volatile. Think fossil fuel phase outs, energy market shifts, job market implications. “All rapid change is likely to go hand in hand with high volatility”, says Verdegaal.
Ortec’s reading suggests the transition could have higher degrees of regional variation. “We think that we'll see increasing differences between regions. Europe scaled back their ambitions because they didn't want to move too far ahead of the global standard but still is a lot more ambitious that for instance the US. We think that this trend of regional differences in transition will likely continue, albeit with ups and downs”, Joolingen points out.
The investment implications of the 1.5°C overshoot are therefore wide ranging. It not only shifts the dial on probable scenarios and their financial consequences, but it also makes the worrying prospect of a volatile, disorderly energy transition more plausible.



