
COP30: UN climate chief predicts first drop in emissions as renewables scale up
In his update to COP30 delegates, Simon Stiell points to cleaner energy generation as a key reason global emissions are beginning to fall
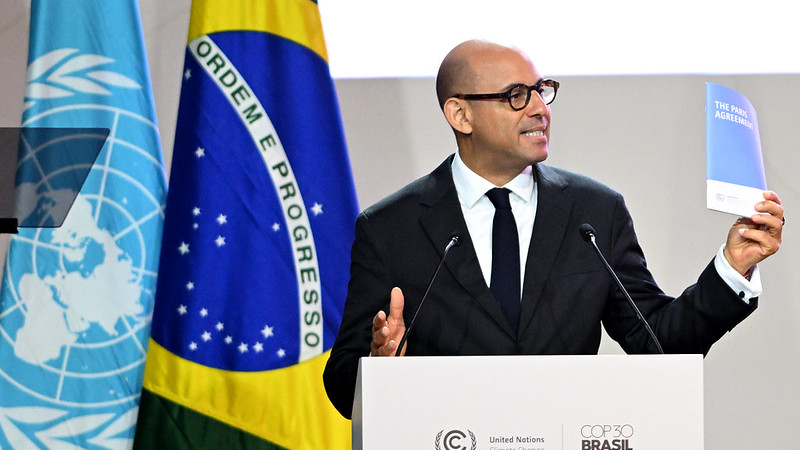
“Ten years ago in Paris, we were designing the future - a future that would clearly see the curve of emissions bend downwards.”, remarked UN Climate Change executive secretary Simon Stiell.
His address at the COP30 opening plenary began with a stock take on where things stand. “Welcome to that future”, said Steill. The curve had been bent.
Nationally determined contributions (NDCs) - the emissions reduction targets countries sign up to – have a lot to do with Steill’s optimism over falling emission projections.
They also have a lot to do with climate investment strategies – from the timing of their reviews to the scenarios they plan for.
In his letter to the COP30 parties, that draws on the 2025 NDC synthesis report, Steill provides the latest update on NDCs – 86 of which have been updated in the days leading up to Belém.
Falling projections, rising targets
It was always the case that for NDC hawks, 2025 was a year to watch. By September, 64 countries had updated their NDCs. Between September and the COP 30 kick off, 49 others joined their ranks. The new NDCs, Steill’s letter stresses, cover 69% of global emissions in 2019, enough to work out a 2035 emissions projection.
By 2035, emissions are forecast to fall by 12%. Before the Paris Agreement was signed, the expectations were for an increase between 20 – 48%.
“The emissions curve has been bent downwards. Because of what was agreed in halls like this, with governments legislating, and markets responding”, said Steill.
Inevitable economics
A falling emissions curve is powered, in part, by the improving economics of mitigation technologies. Think solar panels, batteries, electric cars and grids.
“The economics of this transition are as indisputable as the costs of inaction. Solar and wind are now the lowest-cost power in 90 percent of the world”, Steill explained.
Dr. Kate Katie Manning, a lecturer in climate change, business, and society at King’s College London holds a similar view.
“Overall, the projected emissions for 2030 are about 6% lower than the previous 2021 NDCs and several of the large emitters (the EU, Canada and others) have strengthened their targets”, Manning told Net Zero Investor.
“The good news is that there is a greater uptake of mitigation measures which is likely reflecting a rising technical ambition”, she added.
Devil in the detail
Despite his optimism Steill went on to warn his audience that there was much left to do. “Because individual national commitments alone are not cutting emissions fast enough. We don’t need to wait for late NDCs to slowly trickle in”, he added.
“Not one single nation among you can afford this, as climate disasters rip double-digits off GDP”, warned Steill.
“Broadly speaking, yes, the NDCs are more ambitious this time round. But we should be cautious when translating that to real-world impacts”, says KCL’s Manning.
Margin of error
Part of her reasoning has to do with what the NDCs cover and what they don’t. Current NDCs, Manning says are focused on ‘low cost, high potential’ options.
“Whilst this means that ambition is most likely being pulled up by economic feasibility, it also highlights the way that national ambition is constrained by the same sort of short-term economic priorities that are ultimately at the root of the climate crisis”, she says.
Which begs a related question - how much of the picture do NDCs paint? Manning points out that the progress, or the lack thereof, outside NDCs is harder to track but vital to emissions projections.
“One issue is that most countries under-represent the domestic action on their NDCs due to a range of political and technical reasons – for example, political timing, negotiating strategy, conditionality on external funding”, she explains.
Particularly in developing countries, capacity constraints on NDCs imply there’s more to the emissions reduction story than NDCs filings. If the curve has bent downwards, the changing winds of NDC ambition have surely had their role to play, but so too have a range of other factors that sit outside the visibility of formal notifications to the UN climate chief.


