
Are insurers’ climate risk models fit for purpose?
The sheer quantity and complexity of climate data create serious challenges for risk managers
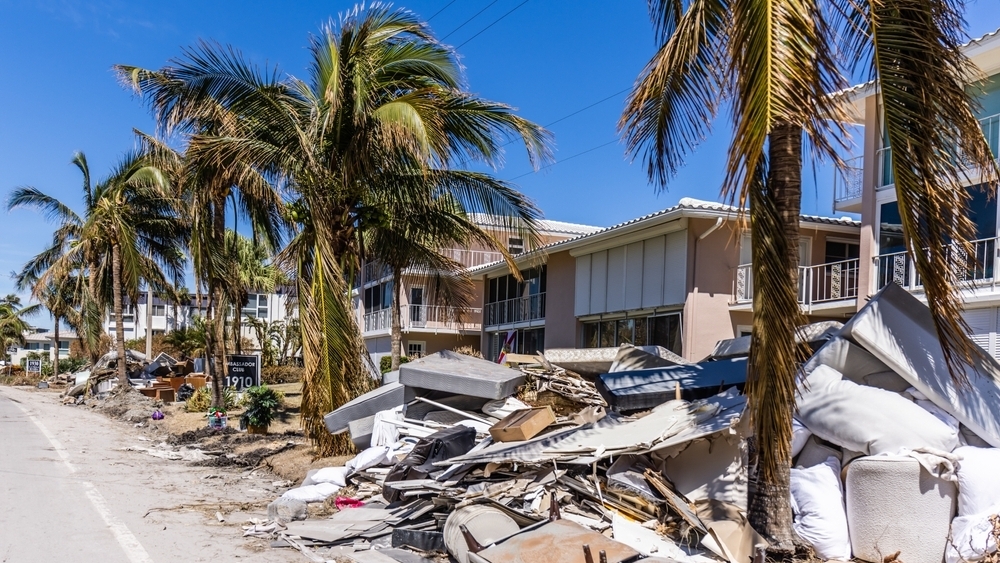
With premiums hitting an all-time high, extreme weather events have triggered an insurance crisis in Florida. New laws aim to make Florida home insurance more affordable while ensuring enough reserve funds to pay for catastrophic losses.
In other words, the market failed and government stepped in. Hyeyoon Jung, a climate risk economist from the Federal Reserve Bank of New York, summed up the implications of the crisis with a single question: Can the insurance sector withstand the stress of climate change?
Many insurers fear that Florida’s crisis is but a taste of the hot new world to come. Such concerns, along with regulatory pressures and shareholder expectations, have made insurers focus on the physical impacts of climate change.
But are their climate risk models fit for purpose?
An imperfect science
The old maxim “you can only manage what you can measure” is true for insurers attempting to adapt to an increasingly heated world. Unfortunately, even with the best intentions, risk managers struggle to model future climate scenarios with accuracy.
One challenge is to operationalise the vast amounts of climate data already out there. Anthony Hobley, deputy chair of climate risk and resilience at Howden Group, said much of the data produced by TCFD and TNFD is qualitative and therefore difficult to “translate into the business language of dollar signs”.
“The insurance industry's job is to take data and science and translate them into what it costs to protect yourself,” he said. “But this is easier said than done.”
When insurers attempt to make sense of weather science data, they also encounter obstacles.
The Coupled Model Intercomparison Project (CMIP) is one of the biggest international efforts aimed at better understanding the past, present, and future of climate changes in a multi-model context. Its sixth phase (CMIP6) include 190 different experiments that were used to simulate 40 ,000 years and produced a whopping 40 petabytes of data.
A climate data consultant who works in insurance told Net Zero Investor that risk models built from this data may suffer from oversimplification.
"This data is so vast and complex that the simple outcomes derived from it - say a certain amount of tornados in the state of Florida in a three degrees world - may in fact be entirely erroneous," they said.
Moreover, the CMIP6 data only looks at physical impacts caused by temperature increases and do not account for tipping points, such as the loss of Arctic sea ice or the collapse of the AMOC (Atlantic meridional overturning circulation), the ocean system responsible for the Gulf Stream.
Tipping points are critical thresholds in the Earth system, where a small perturbation can trigger a significant, often irreversible change in the system's state.
“If you look at the marketing materials for any of the climate risk tools developed by the insurance industry, what you’ll see is a pretty brochure with plenty of complex looking graphs, numbers and maps,” they said. “However, due to limitations in the data and the omission of tipping points, I question the usefulness of these tools for serious risk management.”
MunichRe, for example, promises a modular SaaS solution that “helps you not only to understand your exposure to current physical risks, but more importantly to assess and understand the physical risks associated with climate change in different future scenarios”.
Claiming to benefit from the latest scientific framework and modelling approach (such as CMIP6), the tool provides risk scores on a geographical basis for physical impacts such as sea level rise, tropical cyclones, and storm surges. The aim is to enable the risk manager to see into the future and innovate insurance products accordingly.
Similar tools are also being served up by SwissRe, ClimateX and others.
Last year, Carbon Tracker called out the climate economic models sold by consultants to pension fund clients as “inadequate” and “not fit for purpose”.
A similar dynamic may be playing out among insurers: oversimplification camouflaged by the illusion that an unthinkable amount of data – say 40 petabytes of data – is sufficient for clarity.
A growing business, a growing problem
Due to the triumvirate of pressures: regulation, shareholder pressure, and awareness of ongoing crises in places like Florida, insurers may feel compelled to purchase the latest climate risk management tool – imperfect as they may be – to tick the climate risk box and show they’re doing something.
“Those who develop these climate risk tools not only have to make them look intelligent, but also provide enough leeway not to be pinned down by them,” the climate data consultant said.
Such work also requires “a degree of cynicism”. I.e. knowing they’re not fit for purpose but putting scruples to one side for the sake of a quick buck.
“If the models turn out to be inaccurate, there’s no accountability mechanism,” they added. “The incentives are all out of whack. Those who create the models probably won’t even be at the same firm in 20 years’ time when the inaccuracies begin to show. Yet by then, they may be responsible for the misallocation of billions of dollars.”
Mark Campanale, founder and director of Carbon Tracker, described the consultant's critique as "absolutely fair". "It's important to highlight the perverse combination of proprietary black box models and an IBGYBG culture amongst consultants - with no regulatory oversight of climate scenario analysis/climate risk assessment to keep the industry honest," he said.
IBGYBG is an acronym for "I'll by gone and you'll be gone", a phrase associated with the short-termism of financiers during the run-up to the 2008 financial crisis.
The consultant also worried that inaccuracies in climate risk models used by insurers could create a “black swan” event of the kind that led to the 2008 financial crisis, when financial market participants overly depended on erroneous ratings provided by credit rating agencies.
“It’s not like they’re intentionally generating fake data,” they clarified. “It’s just that depending on oversimplification may end up doing more harm than good.”


