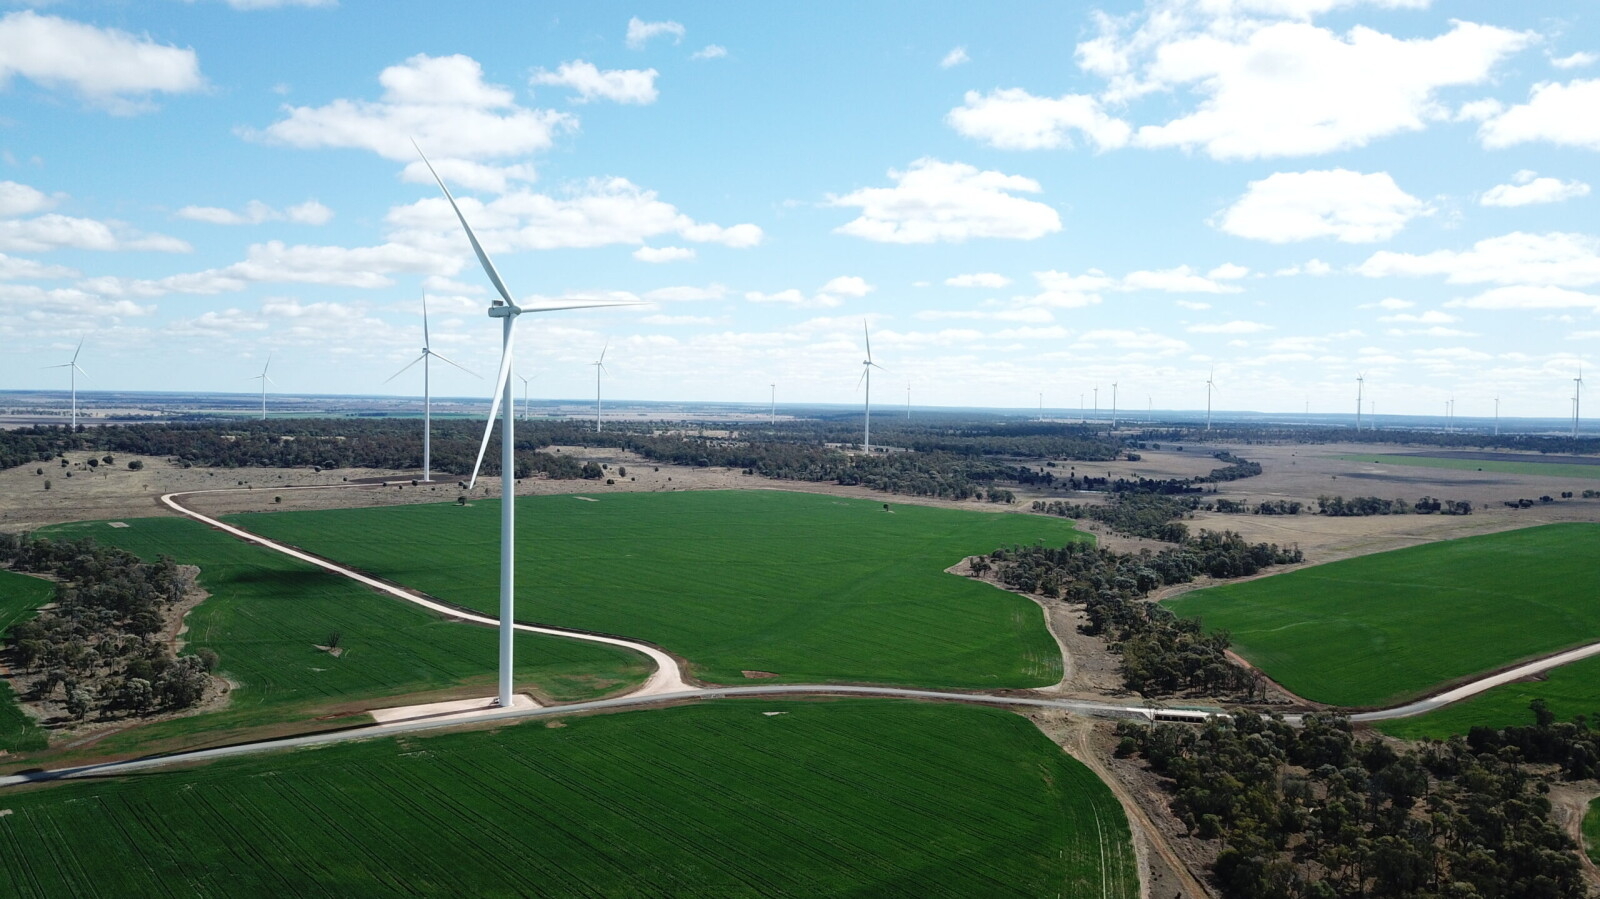
The decarbonisation of the power sector could be underway in earnest as record growth in wind and solar drove the emissions intensity of the world’s electricity to its lowest ever level in 2022, fresh research shows.
Wind and solar power reached a combined 12% share in the global electricity mix, up from 10% in 2021, according to the fourth annual Global Electricity Review from climate and energy think tank Ember.
Together, all clean electricity sources (renewables plus nuclear) reached 39% of global electricity, a new record high. Solar generation rose by 24%, making it the fastest-growing electricity source for 18 years in a row, while wind generation grew by 17%.
The report analysed electricity data from 78 countries representing 93% of global electricity demand, and included estimated changes in the remaining generation.
According to Ember, the increase in global solar generation in 2022 could have met the annual electricity demand of South Africa, and the rise in wind generation could have powered almost all of the UK. Over sixty countries now generate more than 10% of their electricity from wind and solar.
However, other sources of clean electricity dropped for the first time since 2011, due to a fall in nuclear output and fewer new nuclear and hydro plants coming online.
Diego Pardow, Chile’s minister of energy, said: “2023 seems promising at a global level, especially thanks to the prediction of this report, which indicates that emissions from the electricity sector could begin to decrease as of this year. But we still have a long journey to travel, with many challenges ahead and with a clear objective: we must act quickly, always putting people at the centre. There are no more excuses.”
Earlier this year, Net Zero Investor investigated Spanish solar farms as an investment opportunity.