

How are Dutch pension funds scoring on carbon reporting?
Anton Kramer, founder of OverRendement, a Dutch data provider aimed at promoting greater transparency in the pension fund industry, examines how the largest Dutch pension funds are scoring on carbon reporting
The annual reporting of Dutch pension funds for 2023 is not only focusing on financial results. Attention is also given to the impact the pension fund investments have on people and planet. Anyone somewhat familiar with sustainability reporting knows that this is a precarious undertaking. An objective assessment of the effect an investment has on people and planet is not an easy task. Although significant steps are being made in this area, we are not yet at the point where we can objectively determine for every investment what constitutes a good or bad investment from the sustainable point of view. Increasingly, sustainable characteristics of investments are being quantified, but it remains a field that is very much in development.
We take a closer look at the CO2 measurement of the investments made by the five largest Dutch pension funds. This includes the ABP, the pension fund for Dutch public sector workers, with €529bn in assets under management, it is the largest European pension fund. PFZW is the pension fund for the care and welfare sector, it has 3 million members and €257bn in assets making it the second largest pension fund. PMT is the pension fund for metal-and technical sectors and has €84bn in assets, followed by Bouw, a pension fund for the construction sector which has €76bn in assets and PME, which also invests for workers in the metal and technology sector and has €57bn in assets.
First of all, there is a significant difference in the percentage of total assets for which CO2 emissions are measured.
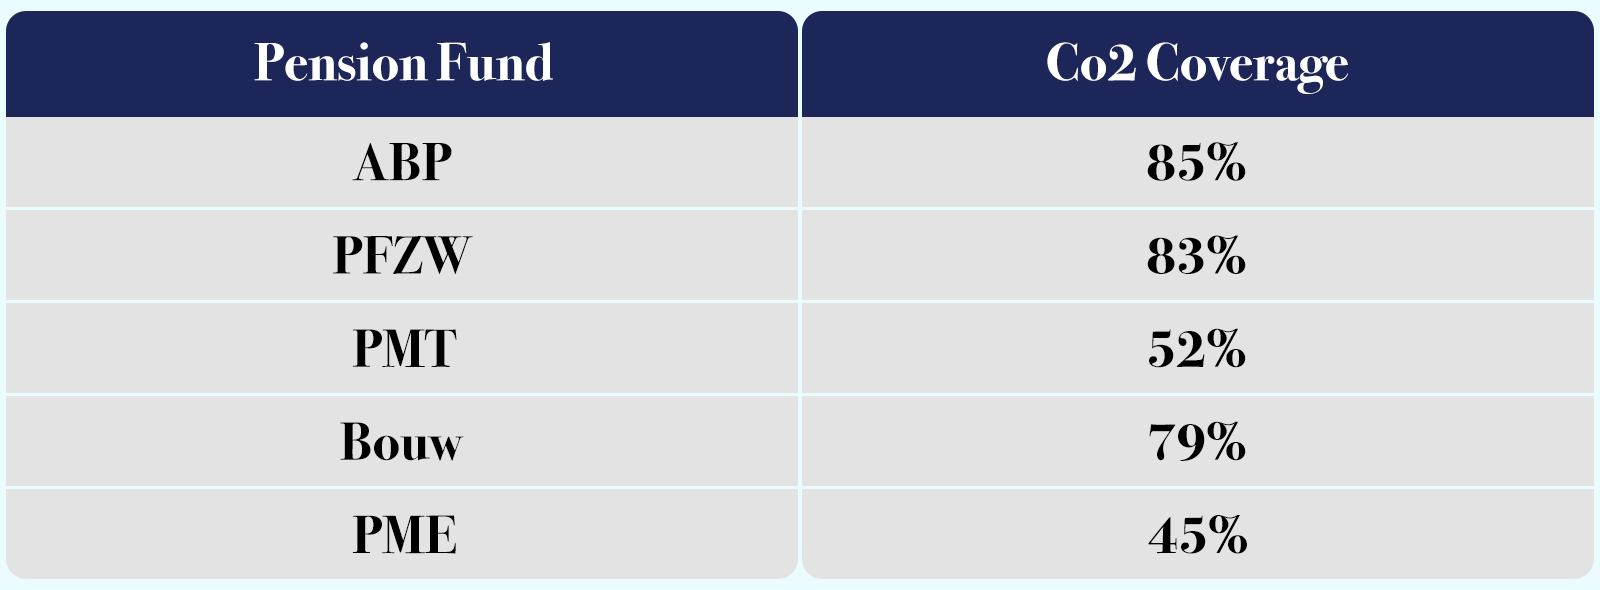
Three of the five funds, ABP, PFZW and Bouw include government bonds in their reporting, which has a significant impact on the CO2 coverage ratio.
When comparing the CO2 emissions of the total portfolio the difference in asset categories also has a significant impact on the reported figures.
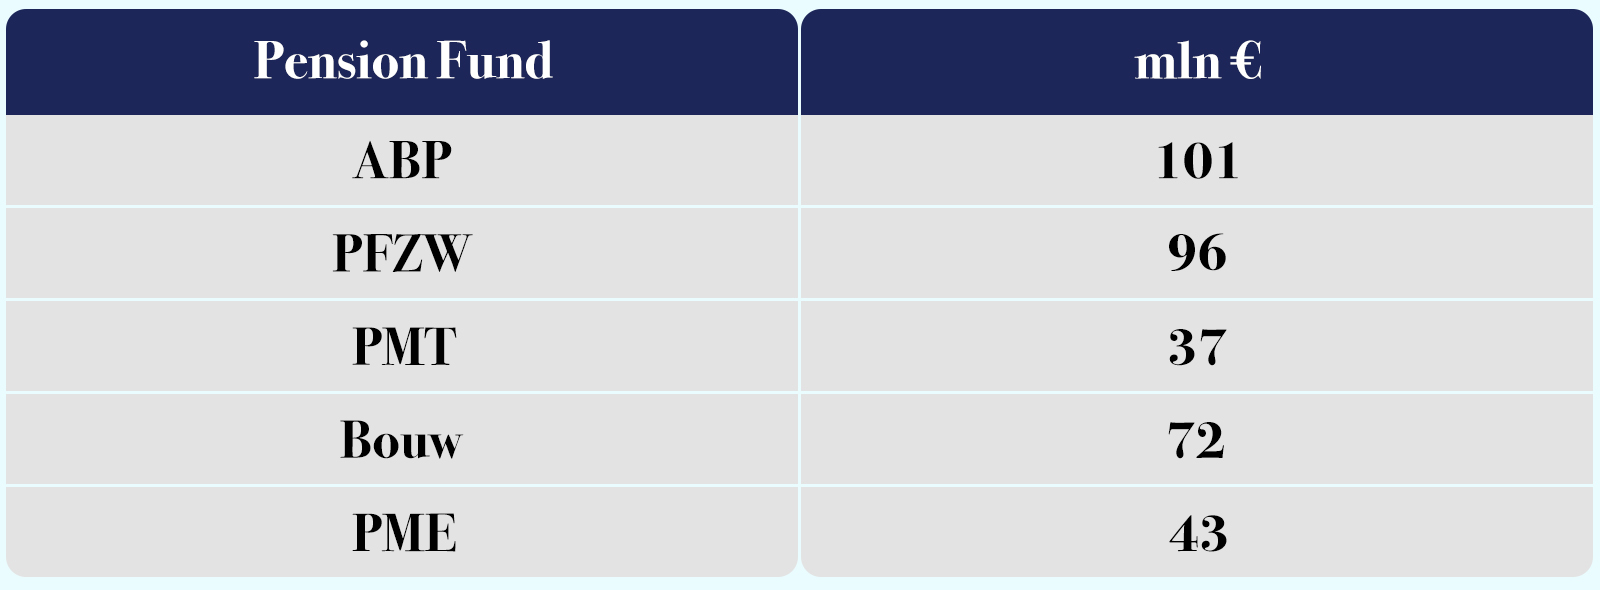
CO2 emissions for sovereign bonds are relatively high as they include all emissions of goods that are produced in that country, including emissions that are reported by companies in that country. This leads to double-counting when combining these figures into an overall figure on pension fund level. Real estate typically has low CO2 emissions relative to the invested capital.
ABP and Bouw also include CO2 emissions of their private equity investments, these are estimates based on public market information. This increases their coverage, however the accuracy of these figures will be lower.
It is therefore more meaningful to assess the emissions per investment category for the categories that all five funds report on. Here we see particularly large differences among pension funds in the category Corporate Bonds. The emissions of PFZW are three times greater than those of PMT.
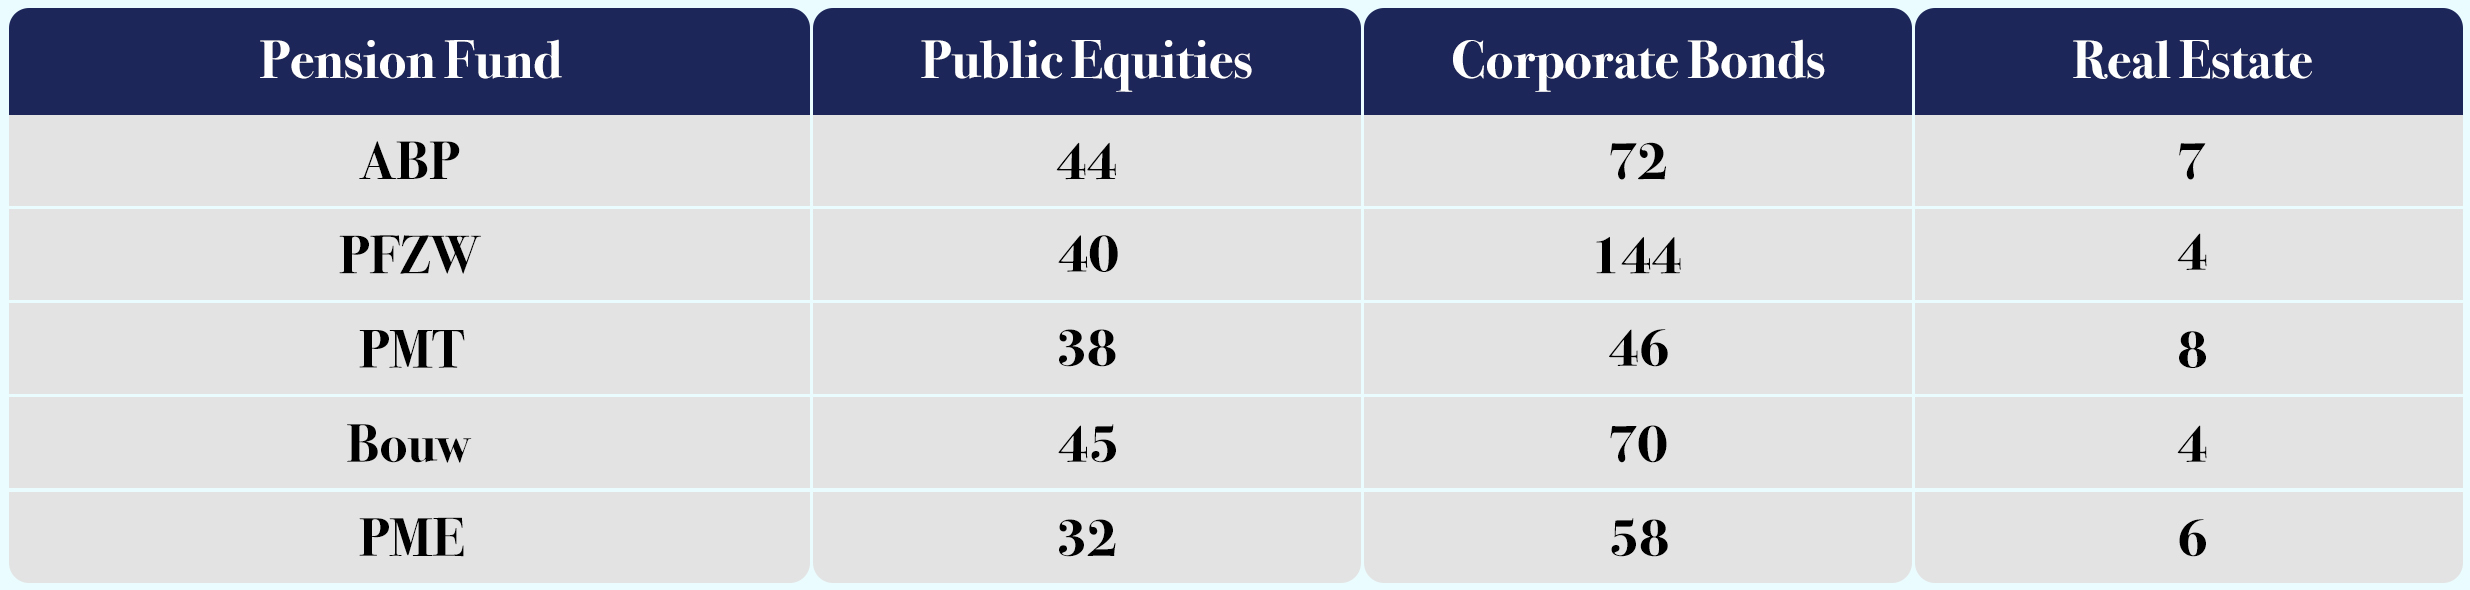
All figures are based on Scope 1 and 2 data, emissions would significantly increase if Scope 3 data, in other words emissions in the wider value chain, would be included.
The large differences in emissions between investment categories raises the question to what extent the carbon footprint of some asset classes should impact asset allocation strategies. Real estate has low emissions, while government bonds have high emissions. Will the trend towards 3D investing (return, risk, and sustainability) lead to a shift in allocation from government bonds to real estate?
An important improvement in reporting would be to be transparent on the CO2 reduction that has been achieved due to lowering the emissions of the underlying companies, compared to the emission reduction that is achieved by disposing of the assets.
Since 2019, pension funds have achieved significant emission reductions, but the indication is that this is mainly due to divestments. Global emissions reached a new high in 2022, while the emissions of Dutch pension funds decreased. This happened at portfolio level, by selling out of heavy emitters or by the companies in question spinning off the heavy emitting parts of their business. While divestment can have a certain impact, global reduction might benefit more from actual reductions by companies. Engagement or divestment can be a dilemma for investors, and it would be beneficial to be transparent on how emission reduction is achieved.
Lastly, comparing CO2 emissions between pension funds will help to put the figures in perspective. Emission reduction objectives are often formulated as a percentage of reduction relative to a base year. Until 2050, when all funds aim to achieve net zero Co2 emissions, this can lead to significant differences between pension funds, while at the same time the funds are on track according to their own goals. Accountability should include comparisons to other pension funds and not look at the data in isolation.
Measuring CO2 emissions is very much work in progress. Better insights can lead to better policies and execution. At the same time, it remains important to keep a close eye on the story behind the figures. Quality takes precedence over quantity, and it is important to use goals and measurements that contribute to the ultimate goal of reducing global emissions.


