
Why the UK’s North Sea cleanup could become a key investment opportunity
The UK’s energy transition is bringing growing attention to the huge cost of dismantling North Sea oil, gas and nuclear infrastructure—costs that could pose risks for investors but also create new long-term investment opportunities
The Energy Transition in Britain is gaining pace. With more than half of the country’s electricity supply now derived from renewables for the second year running, the scale of change is often compared to the nation’s industrial revolutions—first fuelled by coal and later by oil and gas.
The trend towards clean energy is expected to accelerate further. With geopolitical tensions in Iran having driven up oil and gas prices, many investors have identified the scaling of renewable energy infrastructure as a key investment opportunity.
NZI Climate Solutions | 23 June | London | register here
However, an area that has so far received less attention is the cost of decommissioning legacy fossil fuel assets, which could be as high as £240bn, according to new research by BNP Paribas Asset Management.
Decommissioning the UK’s legacy energy, manufacturing, and nuclear estates poses not only a significant credit risk blind spot, but also a potential investment opportunity, as BNP’s Philip Dawes, Julien Halfon, Mark Vickery and Vincent Mayot argue in their white paper.
“For decades, these obligations have been treated as an inconvenient footnote: a cost to be pushed into the future, a problem for the next government, the next regulator, the next generation. But the era of deferral is over. Ageing assets, tightening climate policy, and accelerating transition pathways mean these liabilities are no longer distant abstractions. They are crystallising now — and they are growing,” warns Julien Halfon, head of Pension Solutions at BNP Paribas.
Blind spot
The paper argues that Asset Retirement Obligations (AROs)—the contractual requirement to dismantle and dispose of infrastructure assets once operations cease—remain a blind spot on corporate balance sheets. They are not yet properly priced in and may erode corporate credit quality.
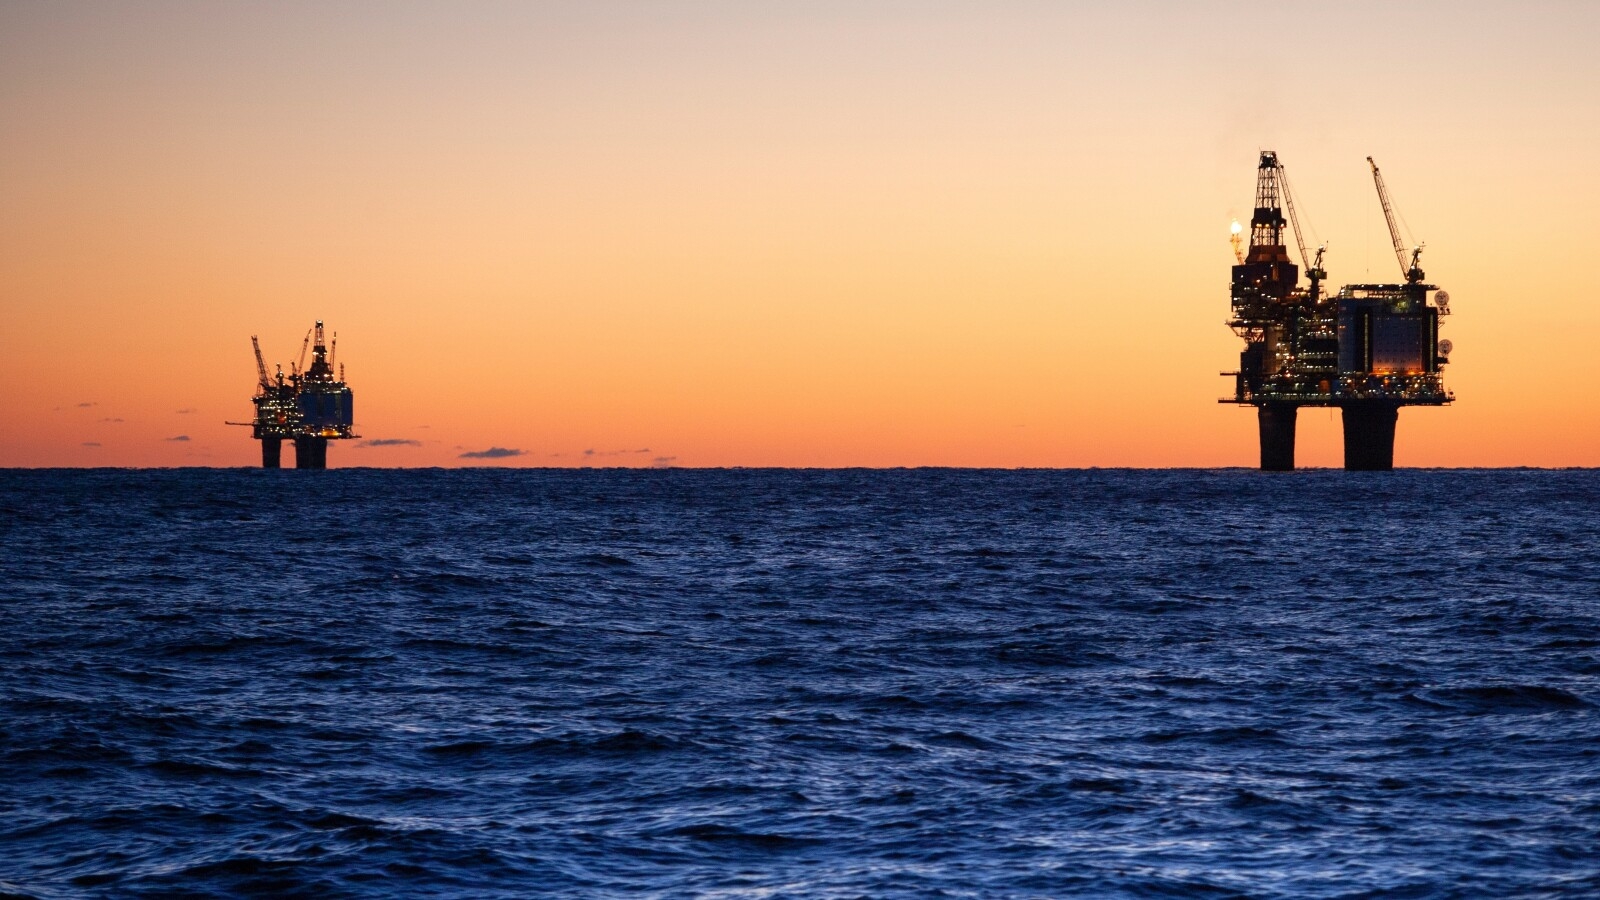
For example, the authors estimate the cost of cleaning up the UK’s civil nuclear estate at £216 billion, with the Sellafield site accounting for more than 50% of that total. Decommissioning costs for North Sea oil and gas are currently estimated to be in the range of £44 billion.
Failing to account for the future costs of clean-up could leave investors exposed to credit, liquidity, and stranded asset risks, they warn. Credit rating agencies are increasingly beginning to incorporate ARO risks into their assessments, yet decommissioning liabilities remain widely “underpriced and underaccounted,” they argue.
Matching cash flows
However, the lack of funding for the decommissioning of oil, gas, and nuclear sites does not only pose a risk—it also presents an opportunity, the authors argue.
They note that many decommissioning liabilities extend over very long horizons of 30–100 years, are inflation-linked, and UK-domiciled. If structured as investment vehicles—such as transition bonds, Decommissioning Reserve Funds, or Redevelopment Trusts—they could provide stable, revenue-backed income streams.
As long-term, inflation-sensitive, liability-driven investors, pension funds and insurers are well suited to match the cash flow characteristics of decommissioning and redevelopment liabilities, the authors suggest.
While some of these tools already exist, with the managed phase-out of fossil fuel assets recognised under International Capital Market Association (ICMA) Transition Bond guidelines, the authors argue that it is now time to scale up these initiatives. They call on policymakers to legislate for Decommissioning Reserve Funds across nuclear, oil and gas, and heavy industry, create a national framework for Transition Bonds and Redevelopment Trusts, and provide targeted co-investment guarantees to support early-stage projects.
For now, funding the decommissioning of fossil fuel assets remains a distant prospect for many institutions. However, with ongoing geopolitical tensions—including disruptions in the Strait of Hormuz—triggering spikes in global oil and gas prices, the decommissioning debate could accelerate sooner than previously expected.
Longview Networks: Institutional Investment Conferences and Summits


