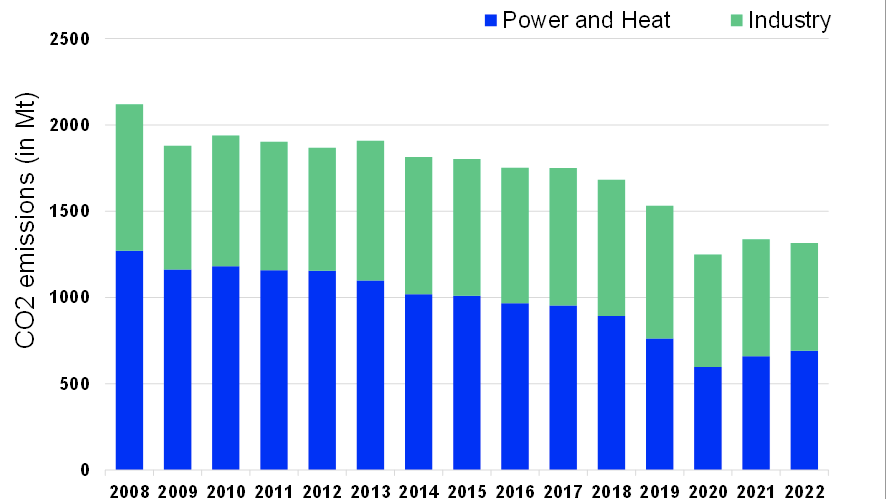
Greenhouse gas emissions from power and industry installations covered by the EU’s Emissions Trading System (EU ETS) decreased by 1.6% last year, according to Refinitiv Carbon Research.
The majority of the of the EU ETS consists of 10,000 fossil power plants and heavy industry installations located across continental Europe. In aggregate, the entities regulated under the EU ETS let out 1316 million tonnes (Mt) of carbon dioxide in 2022, down 21 Mt from the 1,336 Mt emitted in 2022.
Total EU ETS emissions are up 0.2% in 2022, with the large increase in aviation and power sector emissions offsetting the drop in industry emissions.
Power generation in Europe was also more carbon-intensive in 2022 than in 2021. The share of coal in the EU’s power mix rose from 16 percent in 2021 to 18 percent in 2022, though Refinitiv also predicted this rebound to be temporary.
Yan Qin, lead carbon analyst at Refinitiv, said: “Industry sectors are really hit hard by the energy crisis in 2022. The substantial drop in last year’s industry emissions have outweighed the steep rise in power sector emissions due to higher coal burn.
“Coal-fired generation increased sharply as several European countries revived retired coal plants to tackle the gas crunch. The coal revival contributed to 18 Mt rise in the power sector emissions. In addition, skyrocketing gas prices pushed coal plants up in the merit order coupled with reduced hydro and nuclear output and exceptionally high gas prices”.
As coal is more emission intensive than gas, the relative cost of allowances is higher for coal than for gas generation.
EU electricity consumption also declined 4% in 2022, according to Refinitiv due to skyrocketing energy prices which curbed industrial production while individual power users voluntarily reduced consumption.
The lifting of Covid-19 lockdown measures was also found to have boosted travel and air traffic growth, resulting in higher emissions for the sector.
In February this year, a German research paper found that within the Refinitiv ESG database from 2002-2020 there were “1,425 cases where the stated Scope 1 and Scope 2 do not add up to the stated total emissions amount.”