‘Landmark moment’: Australian renewable energy supply reaches record high
The Australian Energy Market Operator (AEMO) has released its latest quarterly assessment of the country’s electricity market. New data shows a 44% reduction, year-on-year, in wholesale prices. Record high renewable energy generation, according to AEMO, are behind the falling prices.
Over the last quarter, the average wholesale electricity price was recorded at $50/MWh. Prices in Q4 2024 in comparison, were $39 higher.
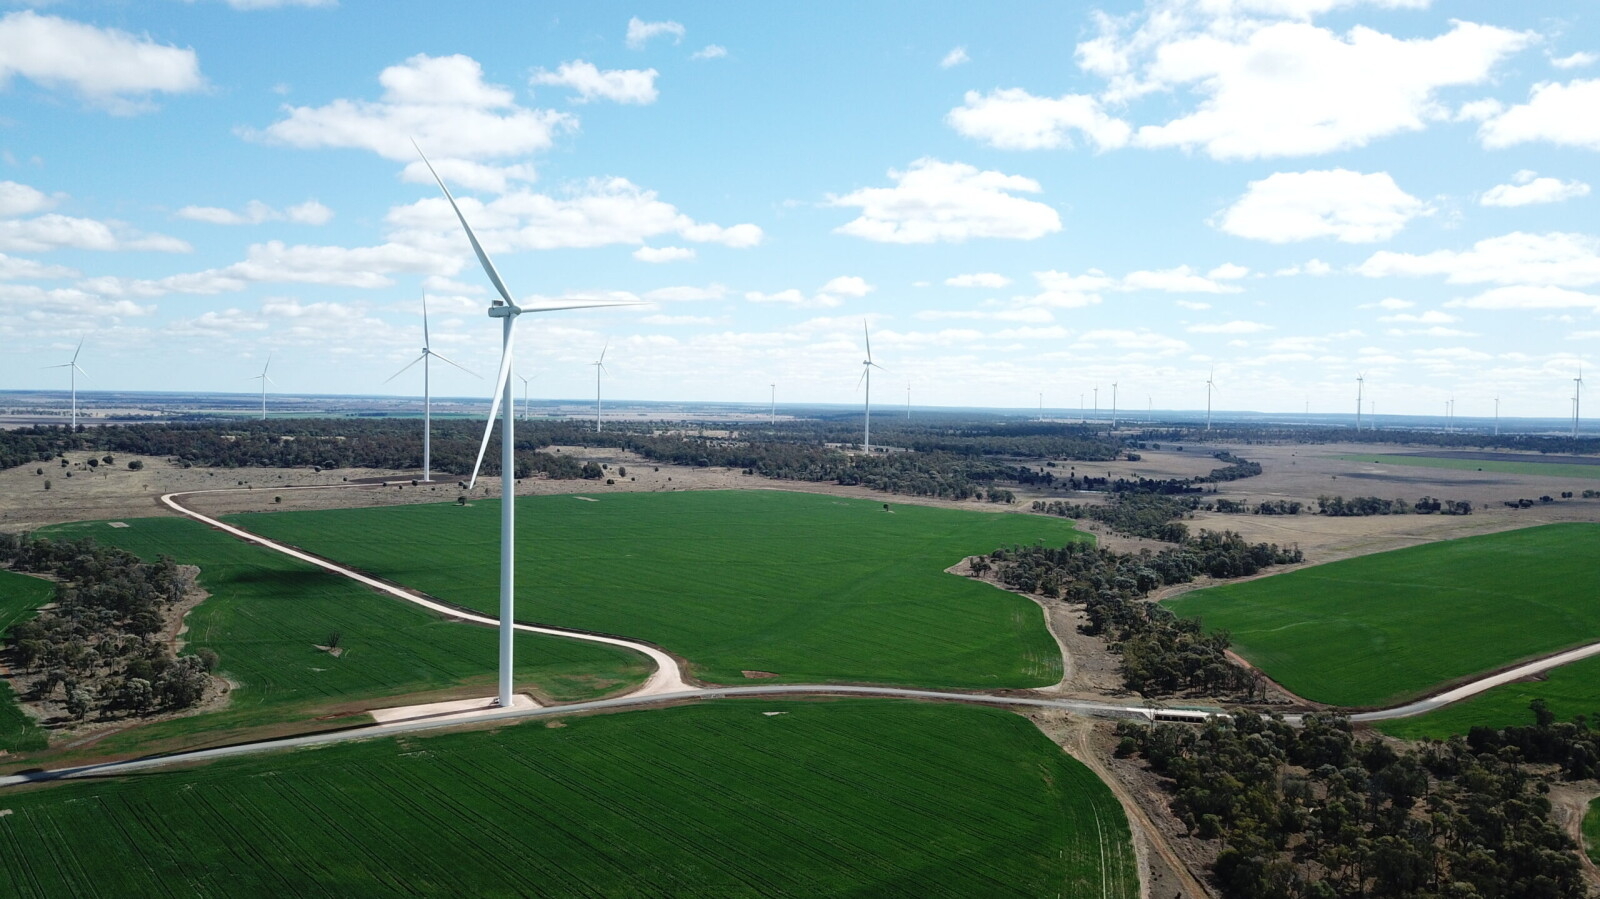
Supply into the market was bolstered by growth in wind and solar generation. The former grew by 29% while grid scale solar expanded by 15%. Additionally, supply from stored energy in batteries nearly tripled. Over 3700MW of new storage capacity has been added since 2024.
“This is a landmark moment for the NEM”, remarked AEMO’s executive generation manager for policy and corporate affairs Violette Mouchaileh.
“For the first time, renewables and storage supplied more than half of the system’s energy needs for a full quarter”, she added.
Strong growth in renewables also reflected in data for Western Australia, a notably gas-powered state. Late in the quarter, renewable energy supply in WA peaked at an all time high of 91%.
Crucially, gas powered energy generation over the quarter was down to its lowest level since Q4 2000.
Mouchaileh says investors consistently backing Australia’s energy transition have had a role to play.
“It [renewables growth] reflects years of sustained investment and demonstrates that more wind, solar and battery capacity in the system reduces reliance on higher cost coal and gas generation, placing sustained downward pressure on wholesale electricity prices”, she explained.