Wood Mackenzie’s ‘most likely’ scenario projects 2.6°C of warming by 2060
Wood Mackenzie, a global consulting firm, has published research projecting 2.6°C of warming by 2060 as the base case scenario. The findings were published in the company’s Energy Transition Outlook 2025 – 2026 report.
According to the company, which also offers services to the oil & gas industry, the new projections reflect surges in power demand coupled with geopolitical headwinds.
“As power demand surges due to the expansion of technologies such as AI and electrification, what was once a mostly aspirational shift towards decarbonization is now facing the hard trade-offs of scale, system integration, capital allocation and geopolitics”, said Prakash Sharma, vice president, head of scenarios and technologies for Wood Mackenzie.
The report projects peak oil demand to shift from 2030 to 2032, despite growth in solar and wind energy deployment. Across all projected scenarios, Wood Mackenzie expects AI technologies to increase demand for natural gas.
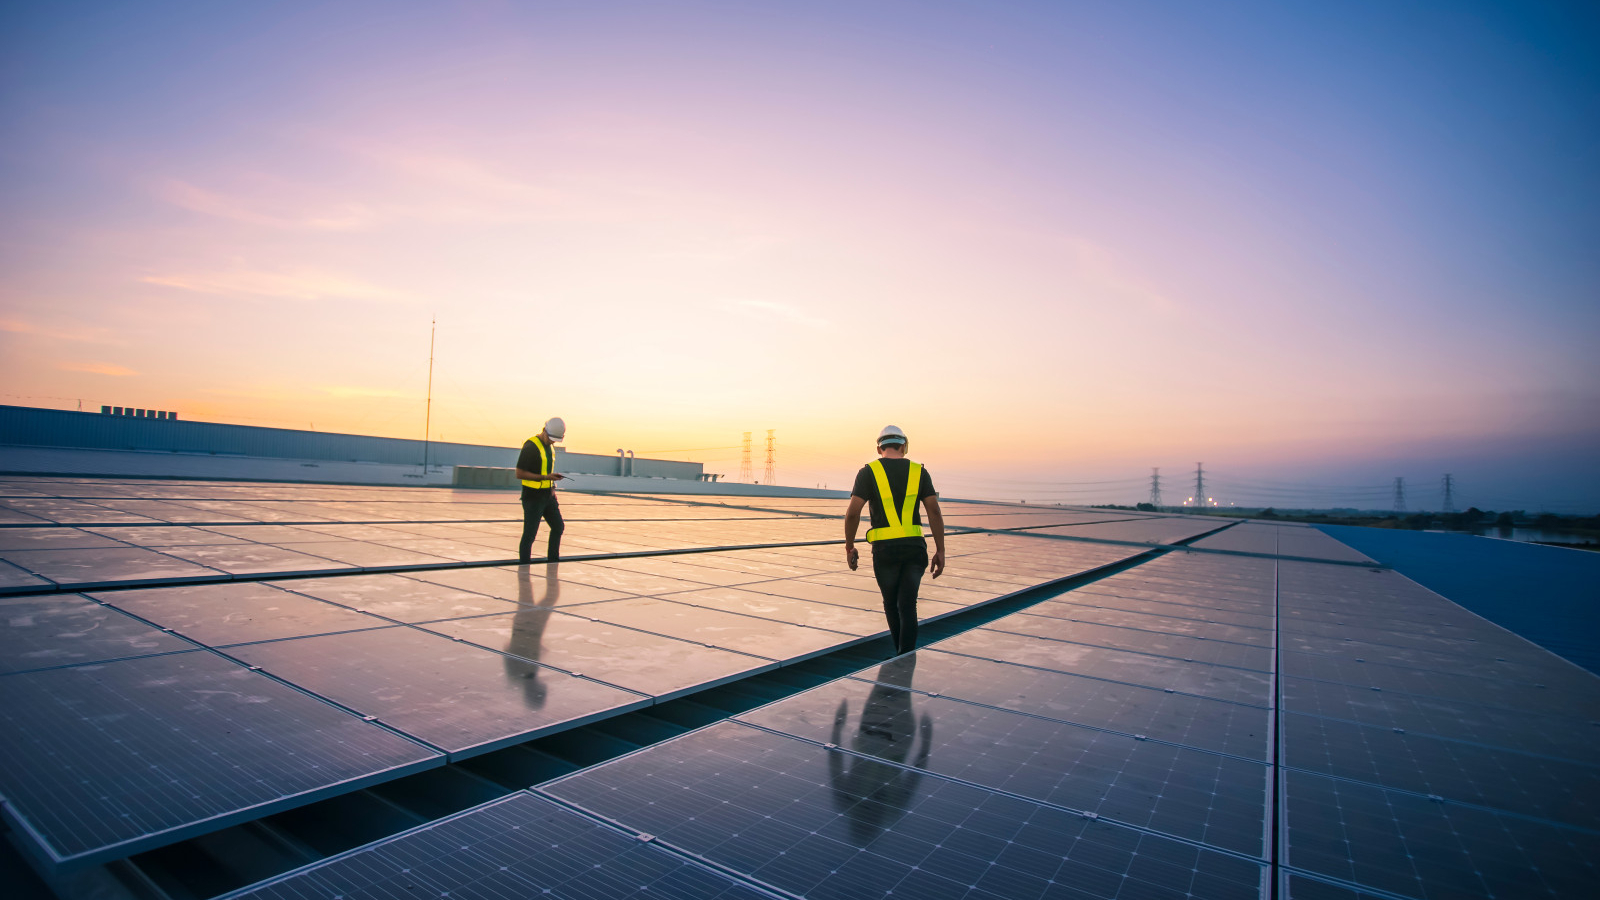
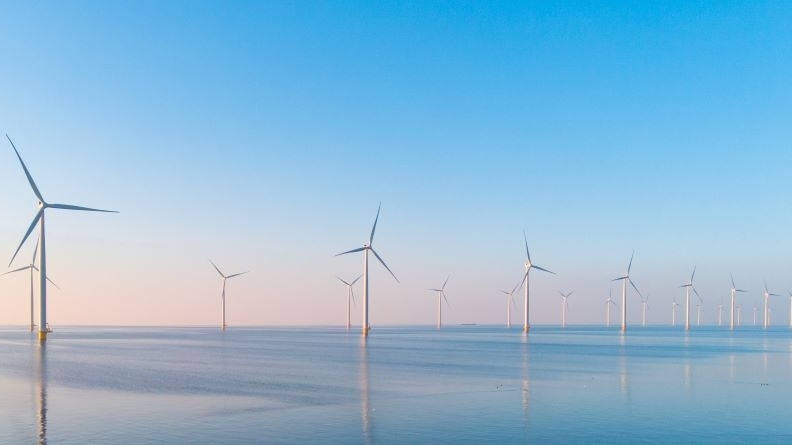
“The share of solar and wind in global power supply has grown from 5% to 20% over the past decade and the surge is expected to continue. But accelerating from deployment to a deeply decarbonized, resilient energy system is proving far more complex than simply adding megawatts”, Sharma added.
Climate leaders
Crucially, the report concludes that no major G7 economy is on track to meet 2030 emissions targets. Consequently, the report’s ‘country pledges’ scenario, projects global net zero emissions beyond the 2050 timeline.
The report also projects that a country-level variation in the energy transition will imply a shift in climate leadership, with China in the driving seat. “As the US doubles down on fossil fuels, pushing allies to buy its LNG, China is seizing the low-carbon mantle through EV and solar dominance, plus aggressive renewables deployment”, said Sharma.
The analysis places heavy emphasis on the next decade, from the perspective of investing in line with limiting warming to below 2°C. With COP30 just a few weeks away, its findings speak to the urgency of addressing underlying headwinds to the energy transition, particularly those underlying worrying projections such as Wood Mackenzie’s base case scenario.