
Solar overtakes gas as key source of global energy supply
Solar photovoltaic has emerged as the single largest contributor to growth in global energy supply for the first time in 2025, with analysts predicting tailwinds for solar stocks
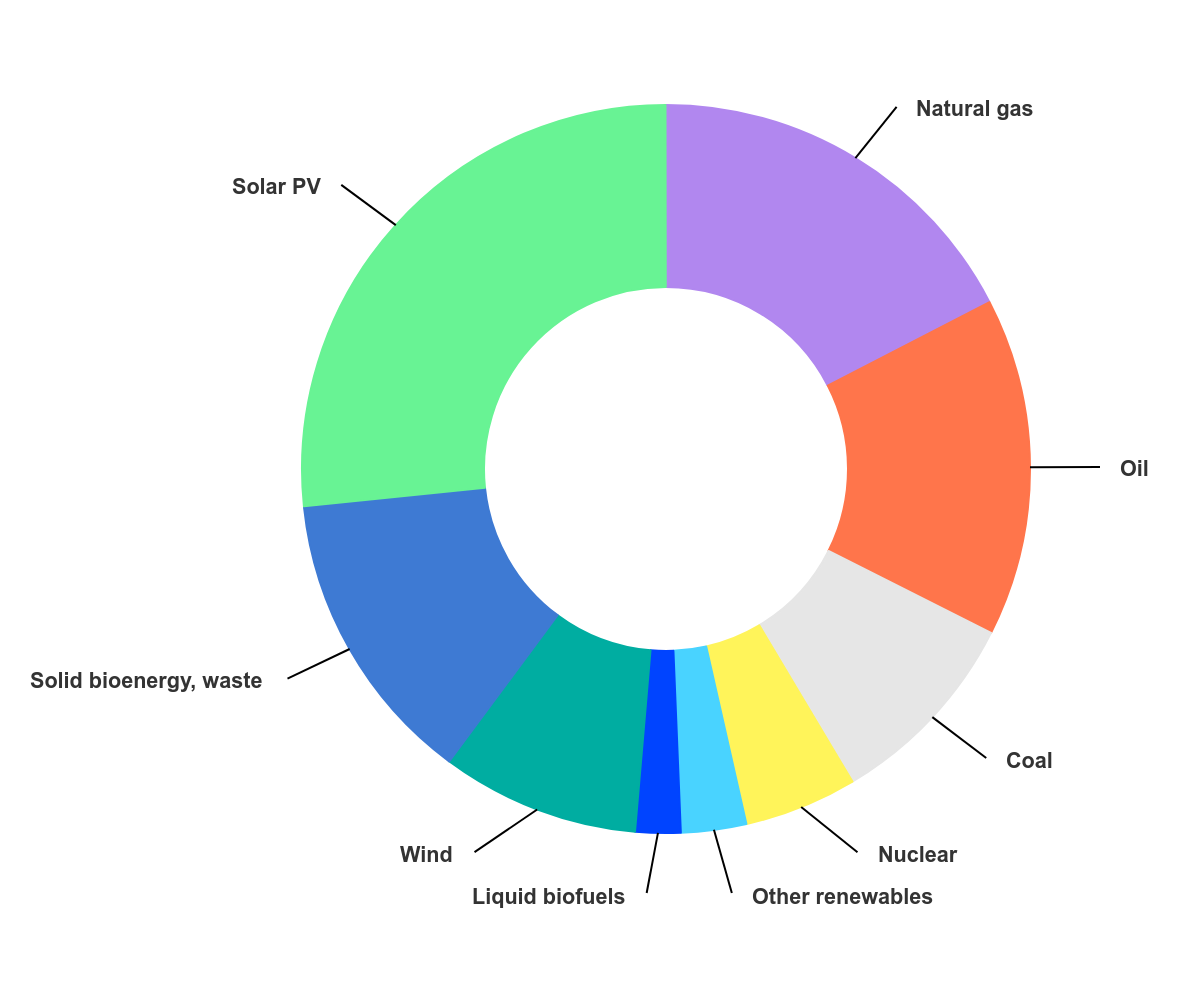
Last year marked a turning point on global energy markets as solar energy emerged for the first time as the largest contributor to energy supply growth, accounting for about a quarter of the increase, according to the International Energy Agency's Global Energy Review.
NZI Climate Solution Summit | 23 June | London | register here
Solar remains closely followed by natural gas, which still accounts for 17% of all new growth but renewable sources and nuclear now meet nearly 60% of all growth in energy demand, the Paris-based multilateral body revealed.
Highlighting the importance of the turnaround, the IEA's executive director Fatih Birol stressed: "In today's rapidly shifting landscape, countries that prioritise resilience and diversification will be best placed to manage volatility and deliver secure and affordable energy in the years ahead."
Fossil fuel demand slows
While overall energy demand continues to increase, demand for oil and gas slowed down markedly in 2025, global oil demand slowed to 0.65 million barrels per day (mb/d), half of the average rise seen over the past decade, with growing demand for EVs contributing to the slowdown.
Meanwhile, while demand for gas still increases, it is rising at much slower rates. In 2025, global demand for gas grew by 1%, compared to 2.4% in 2024, the IEA said, with demand from Asia and the Pacific dropping significantly.
Emerging market emissions drop
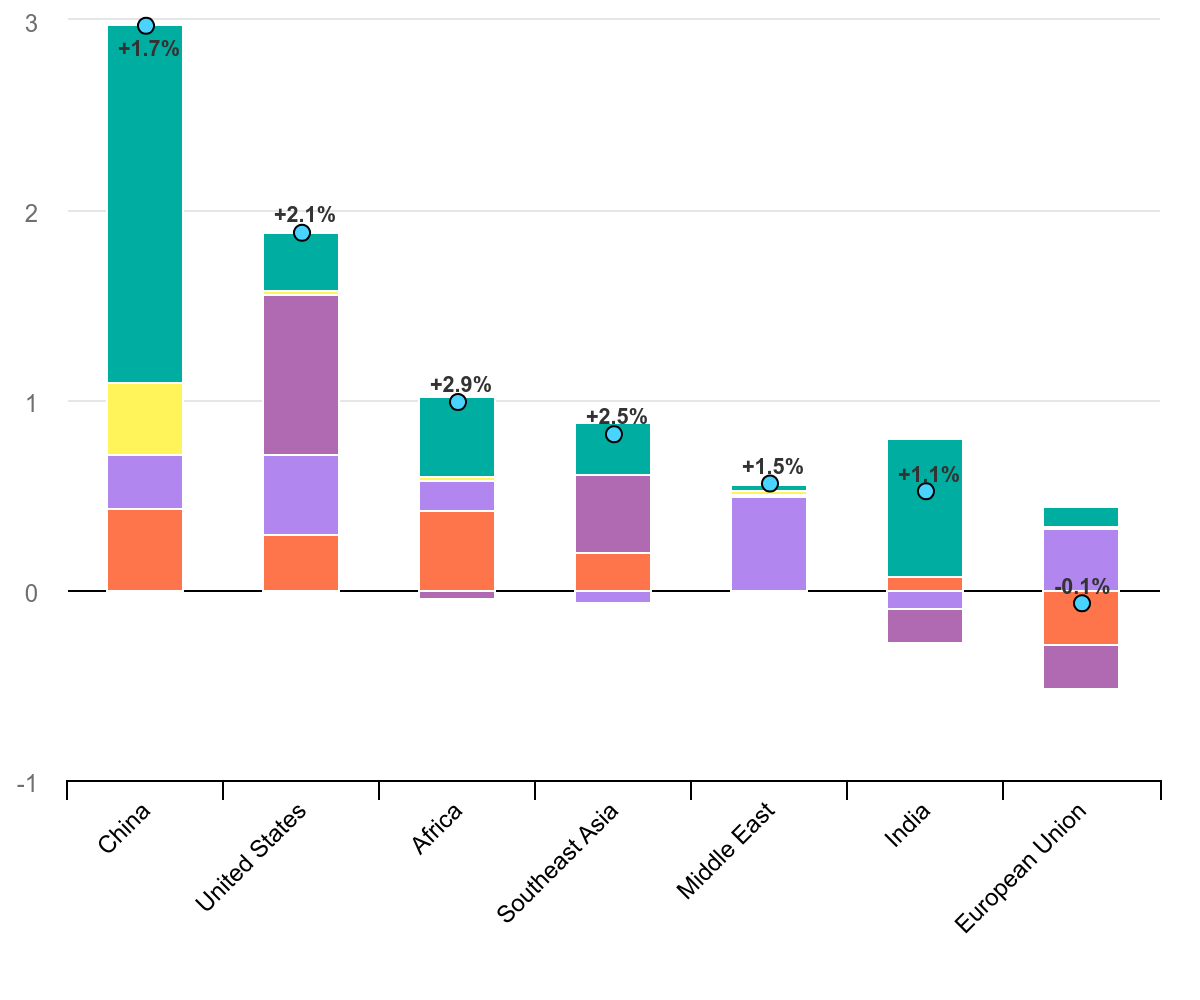
While overall carbon emissions continue to rise, emerging markets have now hit a crucial turning point with emissions in China dropping for the first time, due to the nation's drastic rollout of renewables and structural declines in energy intensive industries, the IEA stated.
Similarly, India's energy-related CO2 emissions were flat for the first time since the 1970s, largely due to cyclical effects from a strong monsoon combined with structural growth in renewables.
In contrast, emissions in developed markets continued to increase, with US coal demand growing by 10% in 2025, driven by higher use in the electricity sector, which accounts for almost 90% of US coal consumption, the IEA said.
Solar stocks set to benefit
While the IEA outlook is based on 2025 data and does not yet capture the impact of the current energy crisis, it adds to an increasingly bullish outlook for the solar energy industry with a growing number of analysts issuing buy ratings for solar energy stocks.
Going into 2026, Goldman Sachs issued an upbeat forecast for solar stocks, predicting a median upside of about 15% across its solar coverage. Meanwhile, Wood Mackenzie predicts that cumulative solar capacity installed worldwide is set to nearly triple from almost 3 TWdc of capacity today to nearly 8 TWdc by 2034.
Meanwhile, share prices for key solar manufacturers, including First Solar and Canadian Solar (CSIQ) have been rising steadily, driven by a combination of growing electricity demand and strong institutional interest in the asset class.
Longview Networks: Institutional Investment Conferences and Summits