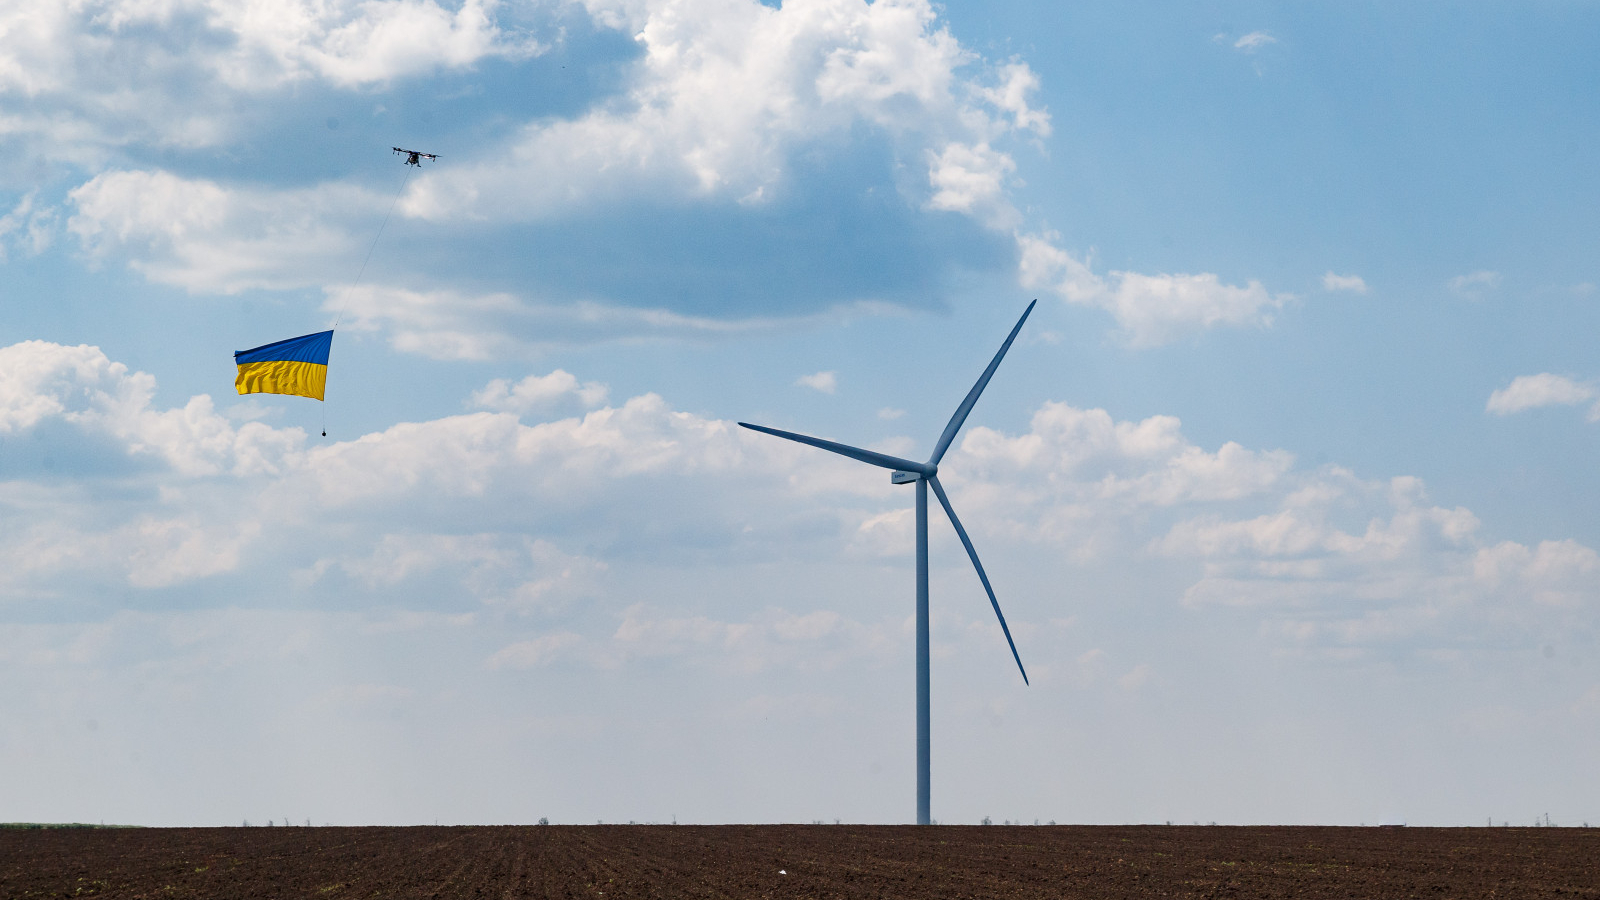
The energy transition doesn’t require a surge in capex but a reallocation
The energy transition is often presented as extremely costly but Kingsmill Bond and Sam Butler-Sloss at the Rocky Mountain Institute (RMI) argue that this is not necessarily true
It is often stated that the energy transition will require a massive and demanding surge in capital expenditure (capex). However, under closer examination, this observation does not hold water.
As we outline in a new report at RMI, the buildout of renewable energy supply does not require a surge in capex but, rather, a capex reallocation from fossil fuels to renewables. A reallocation that has already been in motion for over a decade.
Capex on fossil fuel energy supply peaked in 2012, and has been falling at an average rate of 3 percent per annum since 2015. Meanwhile, capex into clean energy supply has been rising at 6 percent a year since 2015. In 2022, capex on clean energy supply reached $1 trillion, overtaking fossil fuels, according to IEA data.
As we have argued elsewhere, the rapid growth and dramatic cost declines of renewables constitute a technology revolution – they are cheaper, more efficient, and eternally available everywhere. From the perspective of a technology transition, this capital reallocation is simply the standard pattern identified by historian Carlota Perez: capital flows out of areas in decline and into areas with growth.
If we look at the IEA’s announced policies scenario (APS), over the next seven years, renewable capex will grow by 7 percent a year, fossil fuel capex will fall by 5 percent a year, and the net growth in capex will be a modest 2 percent a year.

To put the net growth of 2 percent a year into further context, this is in line with the past seven years and lower than the annual increase in energy supply capex from 2000-2010 of 9 percent; lower than the expected global GDP growth of 3 percent; and lower than the growth in capital formation observed over the past decade. Capital formation in 2022 was $27 trillion, this additional capex on energy supply would constitute only 1 percent of global capex. In other words, this energy transition is highly achievable.
You may be thinking, “Why is this framing different from the standard formulation by, for example, the IEA or IRENA?” Whilst we take the IEA numbers, we restate them to enable a fairer comparison of apples-to-apples. The standard formulation includes the growth in end-use capex for clean technologies but not all the decline in end-use capex for fossil technologies, making the numbers look much more demanding than they are. Moreover, they include capex on end uses such as EV or heat pumps, where the numbers are highly uncertain, and price parity between renewable and fossil fuel solutions is being reached in one sector after another. To keep the comparison fair, we look only at energy supply.
In discussions of capex and the energy transition, it is also noteworthy that capex is only a small part of a much larger picture of the cost of the energy transition. Capex on fossil fuels is $1.1 trillion, but fossil fuel revenues average $3.5 trillion, largely because of the huge payouts of rent to petrostates. Renewables have far lower operating expenses (opex) than fossil fuels: the sun is free; a barrel of oil is not. Furthermore, renewables incur a tiny fraction of the externality costs of the fossil fuel system. The wider the lens, the more attractive renewables get.
Achieving this reallocation still requires hard work. The key now is to move capex from generation to grids, and from developed markets to emerging markets. To do this, we need to shift the perceived challenge away from the volume of capital required and focus on what policies and expertise are needed where and when.
This comment is based on the RMI report The Great Reallocation which can be accessed here.